1) My #1 rule - I try very hard NOT to look at other forecasts. Why? I don't want to be swayed by any other forecasters. I want my forecasts to be my own and with my own experience and gut instincts. It's impossible to avoid them ALL the time though - I watch the local news and they lead off with weather all the time so it's hard to completely tune out. By then though, I'm already familiar with what's going on anyways.
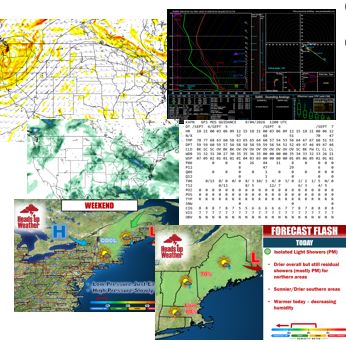
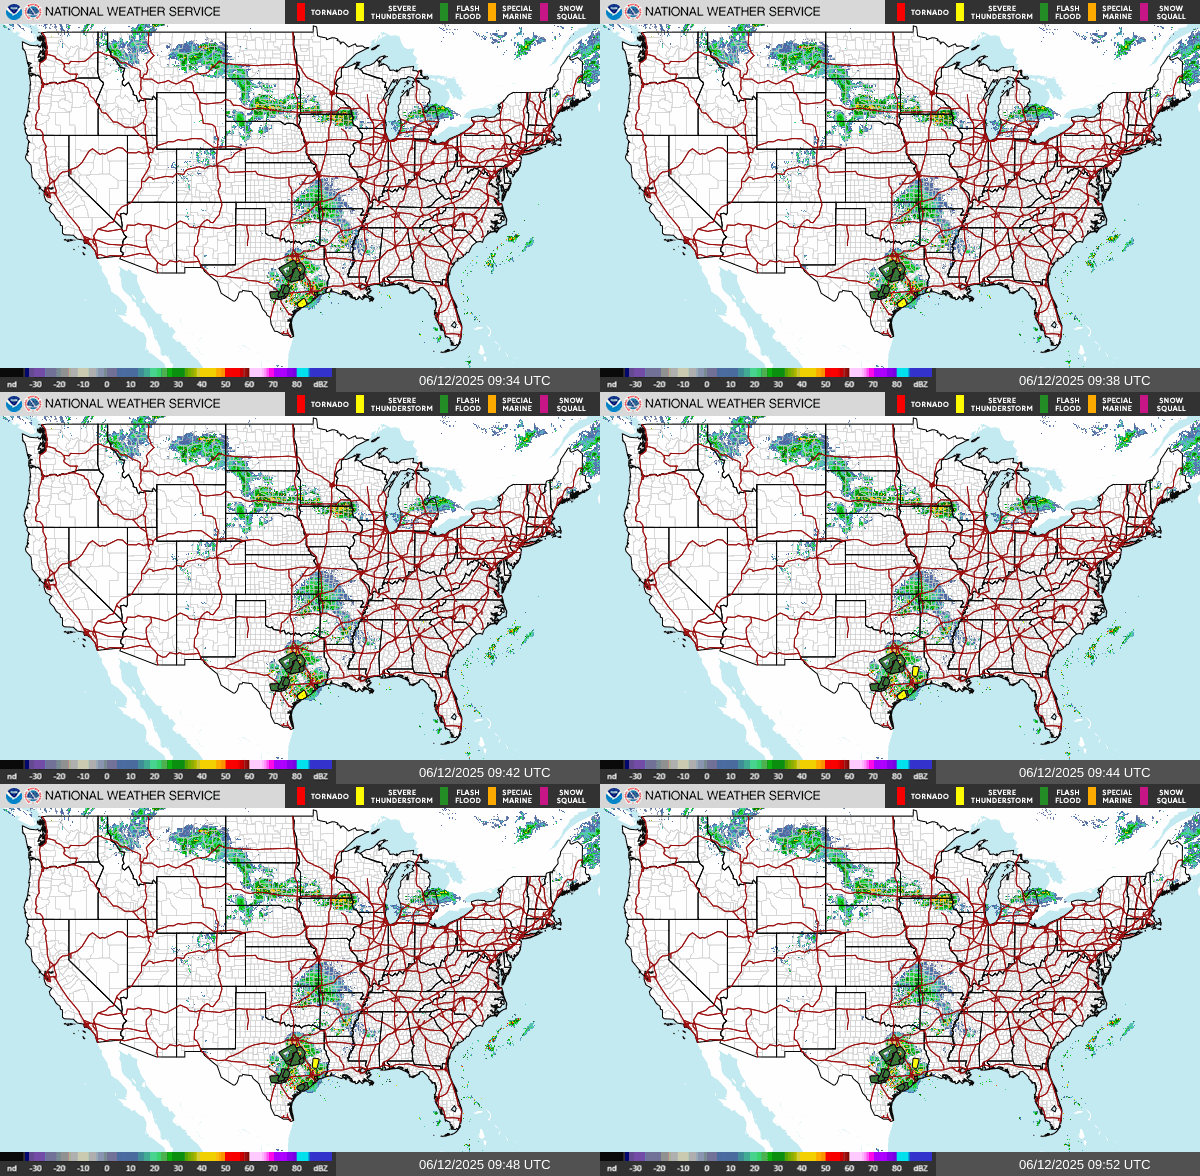
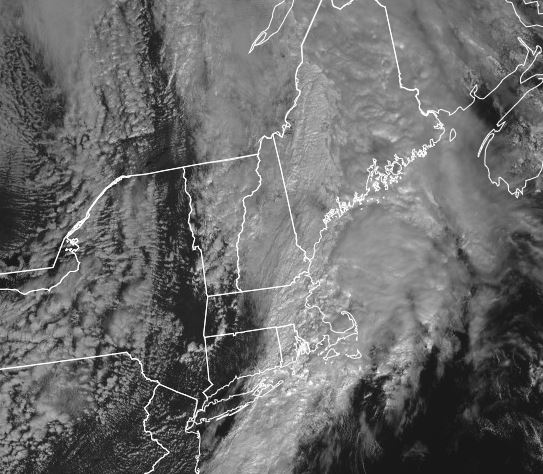
2) I don't just "copy/paste" model output or "rip-and-read" other forecasts. The forecast process is VERY involved starting with looking at current conditions - radar, satellite, surface observations. Then comparing model data. This takes a while!
A big part of the forecasting process is the VIV process - Verify, Initialize, Verify.
The first VERIFY - This means, we look at PREVIOUS model runs and see how it compares to what actually happened. Did that storm end up where yesterday's model showed? Are we warmer/colder now than previous model runs indicated?
INITIALIZE - This is comparing how the model data at the various levels represents INITIAL conditions. Does the inital surface and upper level charts match what they just measured via the weather balloons. If the initial model data under/over measures specific weather features, then you have to consider that through the rest of the model run.
The second VERIFY - comparing how my forecast (and the models) compared to what actually happened.
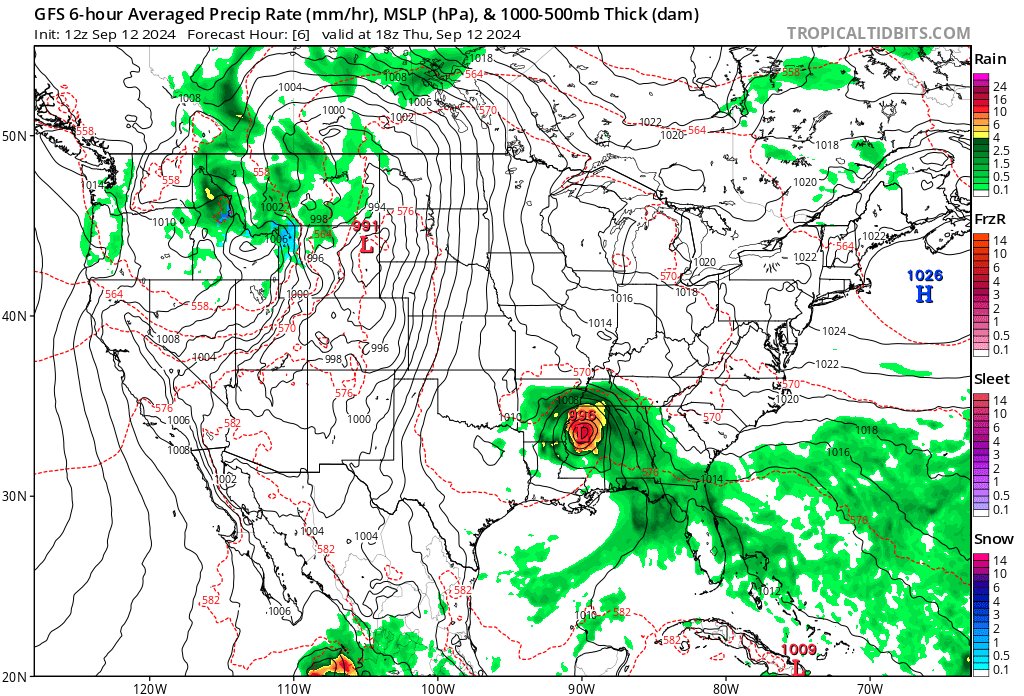
3) MODELS AND TRENDS - Doing the VIV process for one model is time consuming - then you have to do it for all of the OTHER models. Thankfully, digital models make this process MUCH more efficient when you can visually compare multiple models. We used to compare PAPER charts so you can imagine how tedious that was.
Then you have to compare the trends of each model. How are they handling weather features. Are they too fast? Too slow with certain features? Are they trending toward strengthening a storm? Or weakening it? These are the nuances of every model. And it takes time to review and compare.
4) Once I have my forecasting thought process, I translate that to my maps. It is all done BY HAND. I don't have fancy graphics or programs - just Powerpoint. In military forecasting school, I used to hand draw everything. It was just me, raw numbers from weather balloon data, paper charts, and colored pencils - that's it! I drew the current charts, applying all the forecasting rules/principles/concepts we learned to what I thought was going to happen, and drew my forecast maps showing troughs/ridges, highs/lows, fronts, temperatures and dewpoints - everything. NO COMPUTER MODELS! Instructors graded our forecasts compared to what actually happened to see how we did.
Once I make my forecast, I may very well browse other sites/forecasters that may show up in my social media feeds. It's common for many forecasters to follow the National Weather Service, especially for watches/warnings/advisories. They provide detailed discussions about their forecast process and many broadcast meteorologists are in touch with them for more significant storms.
5) I'll write up my text forecast, post my maps, and depending on my schedule and severity of weather impacts, I'll work up some videos.
Generally a solid hour is needed to review and analyze everything. Bigger storm days, MUCH longer. Then time is needed to prepare text forecasts and graphics. Depending on the situation, I may take more time on videos and additional graphics to show meteorological concepts and setups. So it's not a quick rip-and-read process.
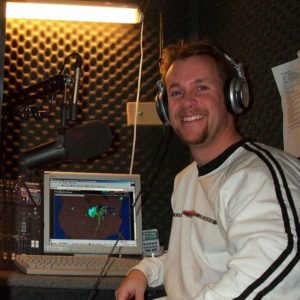
Working as a military aviation forecaster and then a radio broadcast meteorologist, forecasts needed to be DONE by 4 or 5AM - so you can imagine the wakeup times needed to get all that completed by then. Thankfully, I don't have early deadlines like that these days but I do try to post as early in the morning as I can and throughout the day.
So no darts. No crytal balls. No on-the-spot party tricks. Just old-fashioned forecasting done from scratch.